Guides / Stull chart
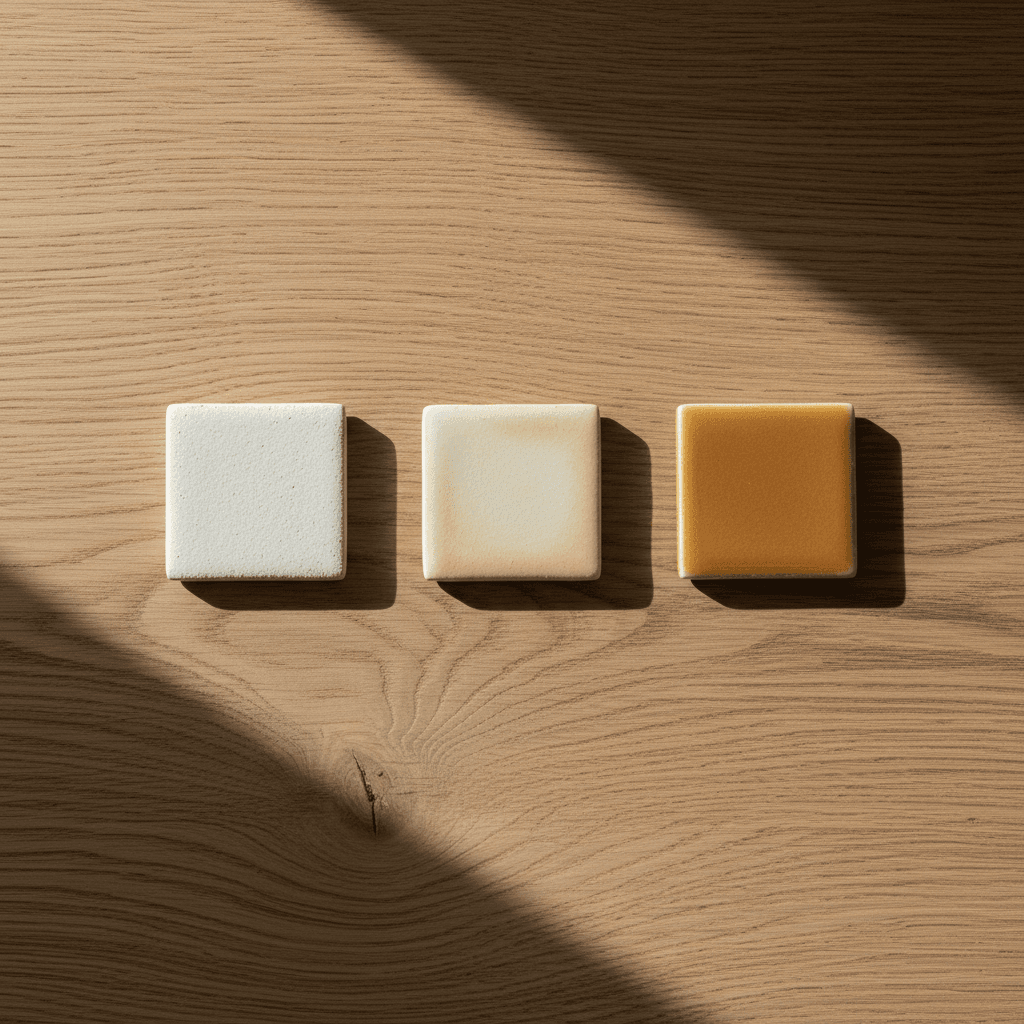
How to read a Stull chart
A 1912 visual map that predicts whether your glaze will craze, crawl, or come out matte — before you waste a kiln load finding out.
If you've ever pulled a piece from the kiln to find your glaze networked with hairline cracks, you've met crazing. If you've seen a glaze ball up into beads, leaving the bisque exposed, that's crawling. And if the surface came out dry and unfused when you wanted gloss, that's underfiring. All three failure modes share a single root cause: the wrong silica-to-alumina ratio.
In 1912, the American ceramic engineer Charles F. Stull published a chart that mapped these failures geometrically. He plotted dozens of glazes on a two-axis grid — silica (SiO₂) on the horizontal, alumina (Al₂O₃) on the vertical — and shaded the regions where each defect appeared. More than a century later, his chart is still the fastest way to predict glaze behavior without firing a test tile.
What the axes mean
Both axes are unity formula values— the molecular ratios you'd see in a Seger UMF calculation. Don't worry about the math. The values come out automatically when an analyzer reads your recipe; what you need to know is what they represent:
· SiO₂ (horizontal) — the glass former. Low silica means not enough material to vitrify; the surface stays porous. High silica means the recipe wants high temperature to melt properly.
· Al₂O₃ (vertical)— the stabilizer. Low alumina makes the glaze runny and prone to crazing. High alumina makes it refractory: matte if you wanted it matte, unfused if you didn't.
Two recipes can have the same materials but plot in completely different zones if their proportions shift. That's the power of the chart — it abstracts away material names and shows you the chemistry.
The seven zones
Modern reproductions (Glazy, Digitalfire, kilnmuse) split Stull's original five zones into seven, with sharper boundaries based on a century of fired data. Here's how each one fails — or succeeds:
Unfused
- Where
- Top-left corner: Al₂O₃ above 0.5, SiO₂ below 2
- Symptom
- Surface stays rough and dry; never melted at the target cone
- Fix
- Add silica (raw flint or quartz) and reduce kaolin
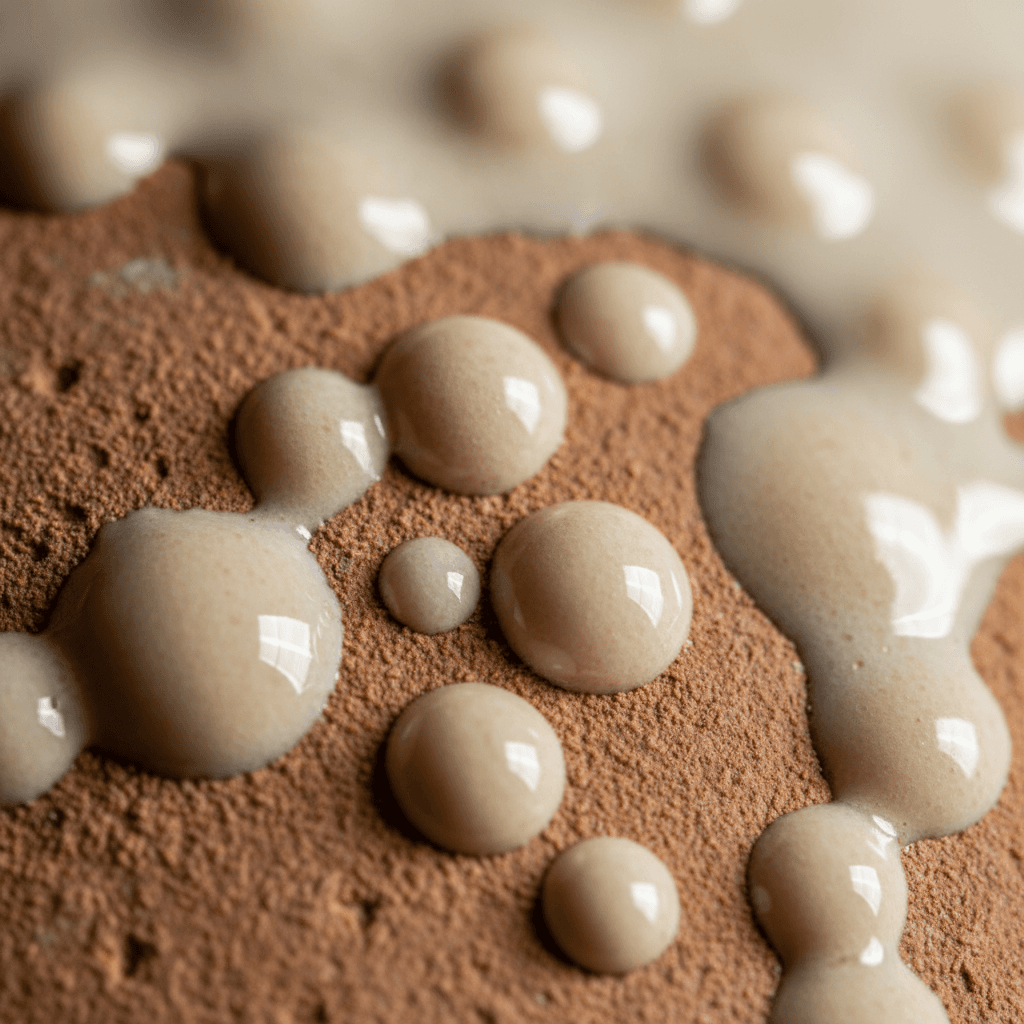
Crawling
- Where
- Top band: Al₂O₃ above 0.7
- Symptom
- Glaze pulls into beads, leaving exposed bisque between
- Fix
- Reduce kaolin or any high-alumina source; apply thinner coats
Matte
- Where
- Diagonal upper band: Al₂O₃ 0.45–0.7, SiO₂ 2–3.5
- Symptom
- No shine — but smooth and well-melted
- Fix
- If you wanted matte, you're done. If not, add silica or reduce kaolin
Semi-matte
- Where
- Transition band: Al₂O₃ 0.35–0.55, SiO₂ 2.5–4.5
- Symptom
- Soft satin sheen — between matte and gloss
- Fix
- Stable working zone; small ingredient shifts won't break it
Bright
- Where
- Center sweet spot: Al₂O₃ 0.25–0.55, SiO₂ 2.5–6
- Symptom
- Durable glossy surface — Stull's classic stable zone
- Fix
- Stay here. The dashed line through it marks 'highest gloss'
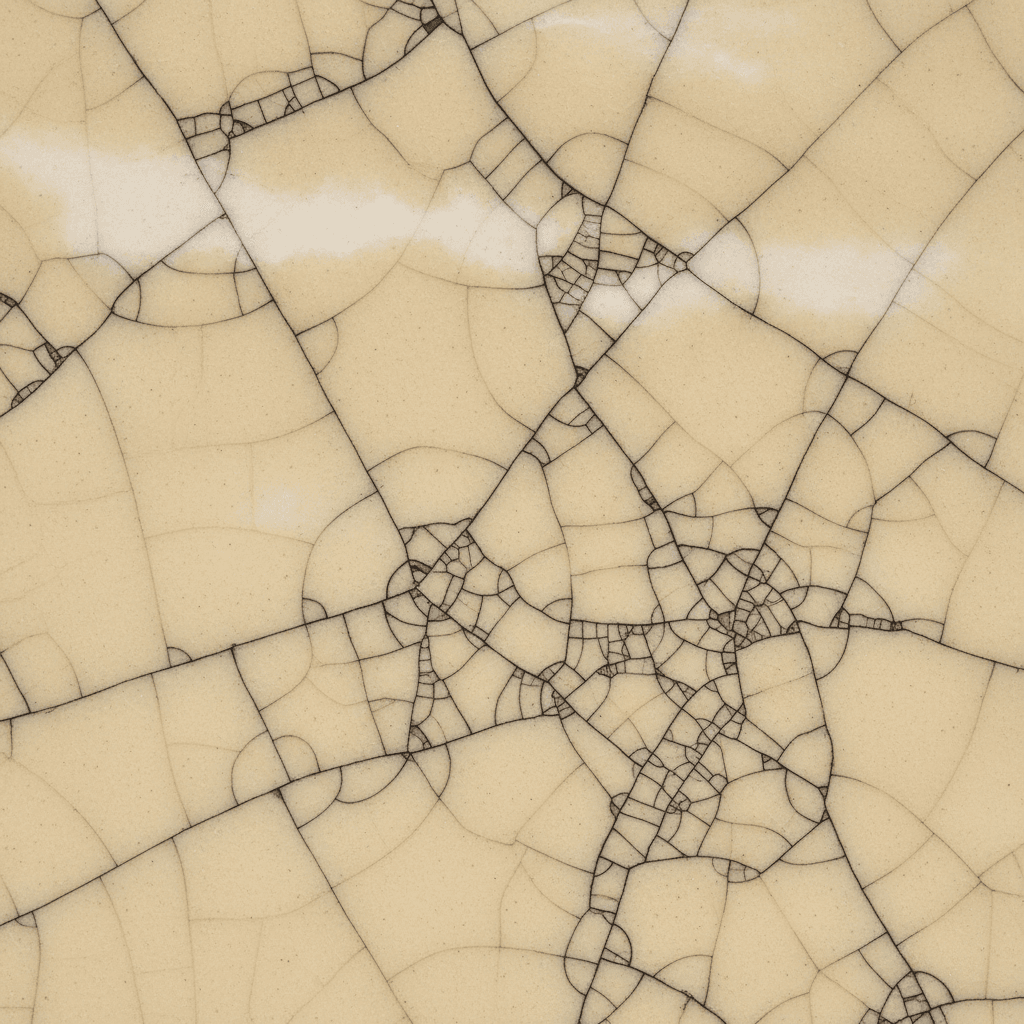
Crazed
- Where
- Bottom band: Al₂O₃ below 0.25, SiO₂ below 4.5
- Symptom
- Network of fine cracks visible on the surface
- Fix
- Add kaolin (raises Al₂O₃) or reduce flux
Underfired
- Where
- Bottom-right: SiO₂ above 4.5, Al₂O₃ below 0.3
- Symptom
- Excess silica without enough flux to melt it
- Fix
- Reduce silica or add more flux (feldspar, calcium carbonate)
A working example
Below is a Stull chart with a sample recipe plotted on it. The dot shows where this hypothetical glaze sits. Click any zone to see its boundary highlighted.
The plotted recipe lands in the crazedzone — its alumina is too low to balance the silica. To rescue it, you'd either add 3–5% kaolin (which raises Al₂O₃) or reduce the silica content (which moves the dot leftward). A glaze chemist with experience does this by feel; a Stull chart shows the math behind the intuition.
What the chart can't tell you
Stull was working at cone 9–11. At lower cones the zones shift slightly — a glaze that's "bright" at cone 10 might be underfired at cone 6 even with the same SiO₂:Al₂O₃ ratio, because the reaction chemistry depends on temperature. The chart still works as a directional guide at any cone, but the exact boundaries move.
It also says nothing about color: a copper red, a celadon, and an iron-saturated tenmoku can all live in the bright zone with very different colorant loadings. Stull is about structure, not pigment. And it doesn't predict crystalline, metallic, or layered effects — those require their own diagnostic tools.
Using it in practice
The shortcut: any time you're editing a recipe, compute its UMF, find the SiO₂ and Al₂O₃ values, and plot mentally on this grid. If the dot lands in a risk zone, your recipe is fragile — small variations in raw-material analysis or kiln position can tip it into actual failure. If it lands in the bright or semi-matte zone, you have headroom for substitutions and batch variation.
kilnmuse runs this calculation automatically every time it generates a recipe — the Stull Chart card on a recipe page shows you exactly where your formula sits, with a one-paragraph diagnosis if it's off.
Try it
Generate a glaze recipe from a photo — with the Stull plot done for you.
Upload an inspiration photo, set your cone and atmosphere, and kilnmuse formulates a recipe + plots it on the Stull chart, runs UMF and Limit Formulas, and generates 9 algorithmic variants in seconds. Free preview, no signup needed for the first try.
Try kilnmuse→References
- Charles F. Stull, "Variations in Glaze Properties Caused by Changes in the Acid and Basic Constituents", Transactions of the American Ceramic Society, vol. 14, 1912.
- Glazy.org — modern Stull chart reproductions and oxide reference data (CC BY-NC-SA 4.0).
- Digitalfire — limit formula data and zone calibration notes across cones.